Unit economics for a SaaS business: what one customer is worth
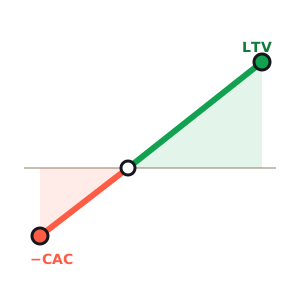
In part one we took a single D2C order apart and found the 70% gross margin was really about 37% once the box actually shipped. A subscription business has the opposite problem. Its gross margins are gorgeous and real — 80% and up is normal — and the trap isn't hidden in the cost of one month. It's hidden in time: you pay the full cost of acquiring a customer today, and you earn it back a slow dollar at a time.
So a SaaS company can post a beautiful margin, grow like a weed, and run completely out of cash — not because any customer is unprofitable, but because it's funding an ever-growing pile of customers who haven't paid it back yet. Part two of this series is about the numbers that make that visible before it happens. The unit is different, the ladder is different, and there's one lever a shipped box will never have.
What is the "unit" in a subscription business?
For a D2C brand the unit was one order — a box out the door. For SaaS, that's the wrong altitude. A single month of a subscription tells you almost nothing, because the whole point of the model is that the customer comes back next month without you spending anything to make them. The unit that matters is one customer, measured across their entire life — every month they renew, minus the one-time cost of winning them.
That reframes the question. It's no longer "did this sale make money?" — it's "how much will this customer pay me before they leave, how much does it cost to serve them along the way, and how long am I out of pocket for the price of getting them?" Three numbers answer it, and they stack into a ladder.
The subscription that costs more to keep than it looks
Start where the D2C order did — with one unit, one month. Our example is a B2B tool at $200 a month per account (its ARPA, average revenue per account). SaaS has no COGS in the physical sense, but "serving" a customer isn't free: there's the infrastructure they run on, the support and success time they consume, and the processor's cut of every charge. Strip those out and you get the true monthly gross profit — the cash one subscription throws off each month.
| Building one month | Amount | Running total |
|---|---|---|
| Monthly price (ARPA) | $200.00 | $200.00 |
| − Infra / hosting | -$12.00 | $188.00 |
| − Support & success | -$18.00 | $170.00 |
| − Payment fees (2.9%) | -$5.80 | $164.20 |
| = Monthly gross profit (L1) | $164.20 | 82% |
Eighty-two percent is a great margin and it's not a mirage — this is the number SaaS deserves its reputation for. But it's only L1, the first rung. It tells you a subscription is cheap to run; it says nothing yet about whether it's cheap to win, or how long a customer sticks around to pay that $164 again and again. Those are the next two rungs.
L1, L2, L3: the SaaS ladder
D2C operators count in CM1/CM2/CM3. The subscription version climbs the same three steps, renamed for a business whose unit is a relationship, not a parcel — call them L1, L2, L3.
- L1 — monthly gross margin. ARPA minus the monthly cost to serve. $200 − $36 ≈ $164. Is one subscription profitable to keep the lights on for? For SaaS the answer is almost always a resounding yes — which is exactly why it's the least interesting rung.
- L2 — lifetime value (LTV). That monthly gross profit, collected for as long as the customer stays. If they churn at 3% a month, the average customer lasts about 1 ÷ 3% ≈ 33 months, so $164 × 33 ≈ $5,470. This is what one customer is actually worth — and it's the number the monthly view can never show you.
- L3 — LTV after CAC. Lifetime value minus what you paid to acquire them. $5,470 − $1,200 ≈ $4,270. The true lifetime profit of one customer. Unlike a D2C first order, this one is comfortably positive — the SaaS trap isn't whether the customer pays off, it's when.
L1 · monthly margin
$164
82% — per account, per month
L2 · lifetime value
$5,470
~33 months before they churn
L3 · after CAC
$4,270
true profit per customer
Read left to right and the business looks wonderful — profitable to run, valuable over a life, and well ahead of its acquisition cost. Every one of those is true. And a SaaS company built on exactly these numbers can still miss payroll. To see why, you have to stop looking at the lifetime and look at the calendar.
Build your own subscription
The sample is one shape; yours is another. A self-serve tool at $29 churns faster but costs almost nothing to acquire; an enterprise deal lives for years but takes months and a salesperson to land. Put in your real ARPA, cost to serve, churn, and CAC and watch the ladder — and the two reads that actually matter — resolve:
The subscription
The cost to serve (per month)
The retention (monthly)
The acquisition
$164.20
L1 · monthly gross margin
ARPA − cost to serve
82%
$5,473
L2 · lifetime value
over ~33 mo of life
net churn 3%
$4,273
L3 · LTV after CAC
the customer's real profit
less $1,200 CAC
CAC payback
7.3 mo
under a year — you fund $1,200 up front, then it's yours
LTV : CAC
4.6x
healthy — $4.6 of lifetime profit per $1 of CAC
Prefer a spreadsheet? Open the free Unit Economics calculator to run all four business models side by side and download a branded, formula-driven Excel of your own subscription.
Two knobs move everything. Drag churn from 3% to 6% and watch lifetime value roughly halve — churn is the single biggest driver of what a customer is worth, because it's in the denominator. Then nudge net expansion up toward your churn rate and watch LTV climb toward infinity. That second knob is the one worth understanding, because it's the thing subscriptions can do that a box never will.
Free · no account · no card
Get your 2027 budget built from your QuickBooks — P&L, balance sheet and cash flow, in Excel.
The number that actually kills SaaS: CAC payback
Here's the calendar the lifetime view hides. You spend $1,200 to acquire this customer today. You earn it back at $164 a month. So you are underwater on that customer for about 7.3 months — the CAC payback period — before a single dollar of them is yours to keep.
CAC payback
7.3months
cash out before this customer is even
LTV : CAC
4.6x
healthy — well past the 3x rule of thumb
First-year cash
-$1,200
you fund every new logo up front
One customer, no problem — you front $1,200 and you're whole by summer. Now grow. Sign ten new customers a month and you're fronting $12,000 a month in CAC, and the ones you signed last month have barely started paying you back. The faster you grow, the bigger the stack of not-yet-paid-back customers you're carrying — and every dollar of that stack comes out of your bank account long before it comes back. That is the SaaS face of being profitable but broke: the P&L is fine, the unit economics are fine, and the cash is on fire. It's a working-capital problem wearing a growth-story costume, and it's exactly what a 13-week cash forecast exists to catch.
This is why the two numbers to tape to your monitor aren't margin and LTV — they're CAC payback (keep it under about a year, ideally under six months, if you're not sitting on a pile of cash) and LTV:CAC (the rule of thumb is 3x or better). Payback tells you whether you can afford to grow this month; LTV:CAC tells you whether growing is worth it at all. A business can pass one and fail the other, and each failure has a different fix.
Negative churn: the lever a box doesn't have
Go back to the calculator and push net expansion up. This is the money your existing customers spend more of over time — more seats, a higher tier, more usage — net of the ones who downgrade. A D2C order can't do this: once the box ships, that order is done, and the only way to earn more is to sell another one. A subscription can grow while it simply stays.
Watch what happens as expansion approaches your churn rate. At 3% churn and 1% expansion, your net revenue churn is 2%, and lifetime value jumps from $5,470 to about $8,200 — the same customer, worth 50% more, because their spend decays slower. Push expansion past churn and something strange happens: net churn goes negative, the revenue from a cohort grows every month instead of shrinking, and LTV has no finite number at all. That's negative churn, the closest thing to a cheat code in business — a base of customers that's worth more next year than this year even if you never sign a new one. It's why investors will forgive a long CAC payback for a company with real expansion: the compounding on the back end pays for the cash gap on the front end.
Four levers that move the customer
When payback is too long or LTV:CAC is too thin, there are only a handful of places to push — and, like D2C, the one everyone reaches for first (spend less on acquisition) is rarely the best one.
- Cut churn before anything else. It's the highest-leverage number on the page because it's in the denominator of LTV — dropping churn from 3% to 2% doesn't add 33% to lifetime, it adds 50%. Onboarding that gets customers to real value fast is worth more than any ad you'll ever buy.
- Earn expansion. Seats, tiers, and usage-based pricing turn a flat subscription into a growing one and bend LTV toward that negative-churn magic. This is where pricing structure quietly becomes the most important growth lever you have.
- Shorten the payback, not just the CAC. Annual-up-front billing is the cleanest trick in SaaS: collect twelve months on day one and the 7-month cash gap disappears entirely — you're paid back before you've served a thing. A modest annual discount is almost always worth the cash it pulls forward.
- Then defend the margin. L1 is high, but infra and support scale with every customer — a bloated cloud bill or support that doesn't get more efficient with scale slowly eats the very gross margin that feeds LTV. Watch cost-to-serve per account as you grow, not just in total.
Need your financials for a lender, a buyer or your accountant? Get the free financials pack →
See what an AI CFO says about your own numbers.
$99/mo, everything included. Free for 14 days, no card.
Prefer to run the numbers yourself? Try the free CAC & LTV Calculator — it’s free.