Break-even: how much do you have to sell to cover your costs?
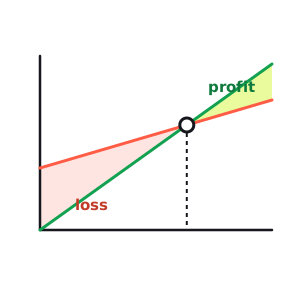
Every business has a number under which it's quietly losing money — a monthly sales figure below which the doors cost more than they bring in. Above it you build savings; below it you burn them. It's the most useful number most owners have never actually worked out, partly because your P&L won't hand it to you: the income statement tells you what happened last month, not the line you had to clear to come out ahead. Break-even analysis is how you find that line — and it's simple arithmetic once you sort your costs into two piles.
We'll build it on one small business the whole way down: a specialty coffee roaster that sells a bag of beans for $18. Each bag costs $7 to make — the green beans, the bag, the label, the valve — and the shop spends $8,800 a month to keep the lights on, whether it sells one bag or a thousand.
Every sale chips in: contribution margin
Start with what a single bag actually does for you. Take the price and subtract only the costs that moved because you sold that bag: contribution margin = price − variable cost. For the roaster that's $18 − $7 = $11. That $11 is what one bag contributes toward covering everything that doesn't move with sales — the rent, the roaster lease, the insurance. It isn't profit. It's the wedge each sale drives into the fixed-cost pile; profit is only what's left once the whole pile is buried.
As a share of the price, that's the contribution margin ratio: $11 ÷ $18 = 61%. Sixty-one cents of every sales dollar survives the cost of the product itself and goes to work on fixed costs. It's the same engine underneath unit economics and the profit read on your income statement — here we just point it at one question.
The break-even formula
Break-even is the sales level where total contribution exactly covers fixed costs — where profit is precisely zero. So the whole question becomes: how many $11 wedges does it take to fill an $8,800 pile?
break-even units = fixed costs ÷ contribution margin per unit| Building the line | Value | |
|---|---|---|
| Price per bag | $18.00 | |
| − Variable cost per bag | $7.00 | beans, bag, label, valve |
| = Contribution margin | $11.00 | 61% of the price |
| Fixed costs / month | $8,800 | rent, lease, insurance… |
| = Break-even volume | 800 bags | $8,800 ÷ $11 |
| = Break-even revenue | $14,400 | 800 × $18 |
Break-even volume
800bags/mo
$8,800 ÷ $11 CM
Break-even revenue
$14,400
the floor before profit
Contribution margin
61%
keeps $11 of every $18
So the roaster has to sell 800 bags — $14,400 — every month before it earns a single dollar of profit. The interesting part is bag number 801: because fixed costs are already covered, its whole $11 of contribution falls straight to the bottom line. That's operating leverage — past break-even, every unit feels dramatically more profitable than the one before it, which is exactly why the first sale of the month is so much harder than the last.
Fixed or variable? Get this wrong and the line lies
The formula is easy; the only real work is sorting each cost into the right pile — and the pile it belongs in is the one whose behavior it matches. A cost that grows when you sell one more bag is variable. One that stays put whether you sell out or sell nothing is fixed.
- Variable: green beans, the bag and label, the card-processing fee, per-order shipping — anything consumed by the sale itself.
- Fixed: rent, the roaster lease, insurance, salaried staff, your software stack — the monthly nut that doesn't flinch at volume.
- Mixed — split them: the utility bill, part of payroll, the delivery van (a fixed lease plus variable fuel). Put the part that scales with sales in variable and the rest in fixed.
Margin of safety: how much room before red
Break-even tells you the floor. Margin of safety tells you how far above it you're standing — the drop in sales you could take before you hit the floor:
margin of safety = (actual sales − break-even) ÷ actual salesSay the roaster actually sells 1,000 bags ($18,000) a month. That's 200 bags — 20% — above the 800-bag floor. Sales could fall a fifth before the business tips into a loss. That one percentage is a sharper read on fragility than any profit figure: two shops earning the same profit are in completely different positions if one has 40% of headroom and the other has 6%.
Past break-even: sizing a profit target
The same machine runs in reverse to size a goal, not just survival. Want to clear $2,200 of profit a month? Treat the target like extra fixed cost you have to cover on top of the real one:
units for target = (fixed costs + target profit) ÷ contribution marginThat's ($8,800 + $2,200) ÷ $11 = 1,000 bags — which, not by accident, is exactly where our roaster is already selling. So its real operating goal was never the 800 bags that keep the lights on; it's the 1,000 that make the $2,200 that makes the whole thing worth doing. Now "how's business?" has a number attached to it instead of a shrug.
What moves the line — and the discount trap
Three levers move break-even: price, variable cost, and fixed cost. Price is the most powerful of the three, because a change in price lands entirely on contribution margin — the $11, not the $18.
| Price per bag | Contribution | Break-even |
|---|---|---|
| $17.00 (−$1) | $10.00 | 880 bags |
| $18.00 (today) | $11.00 | 800 bags |
| $19.00 (+$1) | $12.00 | 733 bags |
This is why a discount is so expensive. Knock a dollar off to $17 and you don't need 5.6% more volume to make it up — you need 10% more, 80 extra bags, just to stand in the same place, because the entire dollar comes out of contribution. A price cut has to buy a lot of volume to pay for itself, which is the whole reason the price–volume–mix of a "successful" promo so often nets out flat.
The other two levers are quieter but real. Trimming fixed cost drops break-even almost one-for-one — cut $1,100 of monthly overhead and the floor falls 100 bags. Shaving variable cost — cheaper packaging, lower card fees, better sourcing — widens contribution on every unit, which is the same lever as raising price without touching the sticker.
See what a report like this looks like on your own numbers.
Meet your AI CFO →Prefer to run the numbers yourself? Try the free Break-Even & Contribution Margin Calculator — no signup needed.