Unit economics for a D2C brand: what one order really earns
Your P&L tells you whether the whole business made money last month. Useful — but it's a rear-view mirror, and it answers the wrong question when you're deciding whether to pour another $10,000 into ads this week. The question that actually matters then is smaller and sharper: does the next order make money? Answer that and scaling is just addition. Get it wrong and every dollar of growth digs the hole faster.
That's what unit economics are — the profit (or loss) hiding in a single sale, stripped of the overhead and the noise. This is the first in a short series on them, and we start where they're most physical and most misread: a direct-to-consumer brand shipping boxes. Because a D2C order looks fat on paper and turns out to be thin, and the gap between the two is where brands quietly go broke while "growing."
What is the "unit" in unit economics?
Pick the smallest thing you sell that repeats, and measure the profit on exactly one of it. For a D2C brand, that unit is one order. Not one customer (that comes later, when they buy again), not one month — one box out the door. Everything about whether the business works is a story you can tell about that single order.
And the number you're chasing on it isn't gross margin. Gross margin — price minus what the product cost — is where most founders stop, and it's where the trouble starts, because between "the product cost me $18" and "this order put cash in my account" sits a whole stack of costs that never touch the COGS line. The honest number is contribution margin: what one order actually contributes after every variable cost of making, selling, and shipping it. That's the atom of the business.
The order that isn't as fat as it looks
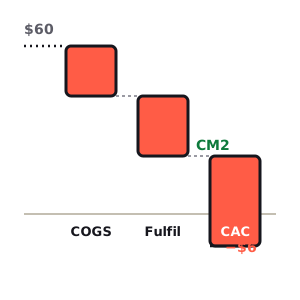
Let's run one all the way down. Our example is a premium bath-and-body brand: a $60 order, product that costs $18 landed. On the income statement that's a gorgeous 70% gross margin — the kind of number that gets a brand funded. Now watch what fulfilling the order does to it.
| Building one order | Amount | Running total |
|---|---|---|
| Order value (AOV) | $60.00 | $60.00 |
| − Product cost (COGS) | -$18.00 | $42.00 |
| = Gross margin (CM1) | $42.00 | 70% |
| − Inbound freight & duty | -$2.00 | $40.00 |
| − Pick, pack & fulfillment | -$3.50 | $36.50 |
| − Outbound shipping | -$7.00 | $29.50 |
| − Payment fees (3.4%) | -$2.04 | $27.46 |
| − Promo / discount (5%) | -$3.00 | $24.46 |
| − Returns reserve (8%) | -$2.44 | $22.02 |
| = Contribution (CM2) | $22.02 | 37% |
Seventy percent on the P&L; thirty-seven percent in real life. Half of the margin you thought you had went to the unglamorous machinery of getting a physical thing to a doorstep — the shipping label, the 3PL, the card processor, the discount code, the returns you know are coming. None of it is a mistake. All of it is the business. But if you plan against the 70% and live in the 37%, you will run out of money and never quite know why — the same disconnect behind being profitable but broke, told at the level of a single sale.
CM1, CM2, CM3: the layers operators actually use
The waterfall above has three landings, and D2C operators name them — CM1, CM2, CM3, for contribution margin one, two, and three. It's worth learning the ladder, because each rung answers a different question and hides a different trap.
- CM1 — gross margin. Price minus product cost. $60 − $18 = $42. This is the number your accounting software shows you, and the one that's most flattering. It only asks: is the product itself sold above cost?
- CM2 — contribution. CM1 minus the variable cost of fulfilling the order: freight, pick-and-pack, shipping, payment fees, promos, returns. $42 − $20 ≈ $22. This is the real cash one order throws off, and the one QuickBooks won't hand you — those costs are scattered across five different expense accounts, not sitting next to the sale.
- CM3 — after acquisition. CM2 minus what you paid to get the customer (CAC). $22 − $28 = −$6. This is the true profit on the first order — and for a huge share of healthy D2C brands, it's negative.
CM1 · gross margin
$42
70% — what the P&L shows
CM2 · contribution
$22
37% — what's really yours
CM3 · after CAC
-$6
first order loses money
Read those three cards left to right and you have the whole story of the brand. The product is genuinely profitable (CM1). Fulfilling it is expensive but still leaves real money (CM2). And spending $28 to acquire a customer who contributes $22 on their first order means you are $6 underwater the moment the box ships. That is not a broken business — but it is a business that only works if the customer comes back. At $22 of contribution per order, that first $28 of CAC is earned back in about 1.3 more orders — so this customer crosses into profit somewhere on their second purchase, and every order after that is gravy. Whether they get there is a question of repeat rate and lifetime value, which is exactly where the LTV:CAC story picks up.
Free · no account · no card
Get your 2027 budget built from your QuickBooks — P&L, balance sheet and cash flow, in Excel.
Build your own order
Don't take the sample's word for it — the leaks are different for every brand. Heavy products drown in shipping; apparel bleeds on returns; a fat discount habit quietly eats the whole contribution line. Put in your real price and cost stack and watch CM1, CM2, and CM3 resolve, and whether order one pays for itself:
The order
The leaks
The acquisition
$42.00
CM1 · gross margin
price − product cost
70%
$22.02
CM2 · contribution
after fulfilling the order
37%
-$5.98
CM3 · after CAC
the first order's real profit
-10%
First order verdict
Loses money
you're $5.98 down until they buy again
Break-even CAC
$22.02
at $28 CAC it takes ~1.3 orders to clear
Prefer a spreadsheet? Open the free Unit Economics calculator to run all four business models side by side and download a branded, formula-driven Excel of your own order.
Two knobs are worth playing with first. Drag the return rate up and watch how fast a healthy contribution line collapses — it's why apparel brands obsess over sizing. Then drag promo from 5% to 20% and see a "small" discount habit erase more margin than your entire shipping cost. Both are levers hiding in plain sight on your own order.
Why a 70%-margin brand can still bleed
Here's the trap the waterfall sets, and it catches good brands with good products. Because CM1 looks great, the instinct is to grow — buy more ads, run more promos, chase more first orders. But every extra first order is a −$6 CM3 — you're paying to acquire losses, betting the repeat purchase bails you out later. Do that faster than the repeats come in and you get the cruelest version of the working-capital squeeze: the faster you grow, the more cash you burn, even though the business is "profitable per customer" on paper.
This is why unit economics have to be a per-order discipline, not a month-end surprise. The P&L nets everything together and hands you a single line that can hide a negative CM3 behind a pile of loyal repeat buyers — right up until the mix shifts toward new customers and the whole thing tips over. The order-level view is the early-warning system the aggregate can't give you. (It's the same reason to read your income statement for margin, not just the bottom line.)
Four levers that move the order
When CM2 is thin or CM3 is underwater, there are only a handful of places to push — and the fastest wins usually aren't the one everyone reaches for first (cutting CAC).
- Raise the order value. A bundle, a free-shipping threshold at $75, a one-click add-on. Every extra dollar of AOV lands at your gross-margin rate, and it spreads fixed per-order costs (pick-pack, the flat part of payment fees, shipping) across a bigger basket — so CM2% climbs faster than AOV does.
- Stop the shipping bleed. Outbound shipping was the single biggest leak in our order — $7 of a $60 sale. Negotiated carrier rates, right-sized boxes, a shipping charge above a threshold, or regional 3PLs that shorten the zone all drop straight to CM2.
- Attack returns and discounts. These two are pure margin with nothing to show for it. Better sizing guides and product photography cut returns; a little discipline on the promo calendar (fewer sitewide sales, more targeted offers) keeps the discount line from swallowing the contribution you worked for.
- Then earn the repeat. A negative CM3 is only fatal if the customer never comes back. The highest-leverage move in all of D2C isn't shaving CAC — it's the second order. That's a whole discipline of its own, and it's where the LTV:CAC math takes over.
Need your financials for a lender, a buyer or your accountant? Get the free financials pack →
See what an AI CFO says about your own numbers.
$99/mo, everything included. Free for 14 days, no card.
Prefer to run the numbers yourself? Try the free CAC & LTV Calculator — it’s free.