What's a healthy LTV:CAC ratio? (and how to find yours)
If you spend a dollar to get a customer, will you make it back — and how long will that take? It's the question that decides whether paid growth compounds or quietly bleeds you, and it's the one your accounting software can't answer. QuickBooks knows what you sold and what you spent; it doesn't know what a customer is worth or what one costs. That gap has two numbers in it — CAC and LTV — and once you can read them together, "are the ads working?" stops being a vibe and becomes arithmetic.
We'll build both from a single running example: a small DTC apparel brand that spent $24,000 last quarter and picked up 300 customers. Sells a $65 order at a 55% margin; a typical customer comes back about twice a year and sticks around a couple of years.
What should CAC include?
CAC — customer acquisition cost — is the fully-loaded price of one new customer: total acquisition cost ÷ new customers. The word that trips people up is total. It isn't just ad spend. It's the ad spend plus the creative, the agency retainer, the tools, the discount codes and affiliate payouts — every dollar that existed to turn a stranger into a buyer. Leave those out and your CAC looks great right up until the bank balance disagrees.
Our brand spent $20,000 on ads and another $4,000 on creative and tools — $24,000 to land 300 customers. So CAC is $24,000 ÷ 300 = $80 a customer. Hold that number; it only means something next to what a customer is worth.
How do you calculate LTV — honestly?
LTV — lifetime value — is the total profit a customer brings over the whole relationship. The single biggest mistake founders make here is building LTV on revenue. A customer who spends $1,000 with you is not worth $1,000 — they're worth the margin left after the cost of goods, the payment fees, and the shipping. LTV is built on contribution margin, not the top line. Anything else flatters the number and hides the truth.
The honest build has two halves — what one order contributes, and how many orders a customer places before they're gone:
LTV = (AOV × gross margin %) × (orders per year × customer lifespan)| Building LTV | Value | |
|---|---|---|
| Average order value (AOV) | $65.00 | |
| × Gross margin | 55% | |
| = Contribution per order | $35.75 | the cash one order keeps |
| Orders per year | 1.8 | |
| × Customer lifespan | 2.5 yrs | |
| = Lifetime orders | 4.5 | |
| Lifetime value (contribution) | $161 | $35.75 × 4.5 |
What's a healthy LTV:CAC ratio?
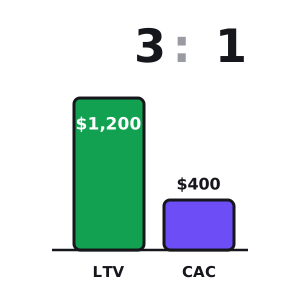
Now put the two numbers together. The LTV:CAC ratio is exactly what it looks like — lifetime value divided by acquisition cost — and the rule-of-thumb every investor quotes is 3:1: a customer should be worth about three times what they cost to acquire. Below ~1:1 you lose money on every customer. Around 3:1 you're healthy — enough margin left over to cover the overhead that CAC and COGS don't. Much above 5:1 and you're usually under-spending: leaving growth on the table because you're scared of the ad bill.
Cost to acquire
$80
CAC — fully loaded
Lifetime value
$161
LTV — contribution
LTV : CAC
2.0: 1
below the 3:1 healthy line
So our apparel brand is at 2.0:1 — making money on each customer, but not enough headroom to be comfortable. That's the kind of verdict a spreadsheet full of ad-platform ROAS will never hand you, because ROAS ignores repeat purchases and margin. Don't take the example's word for it — drop in your own order value, margin, repeat rate, and ad spend and watch every number resolve:
The customer
The acquisition
$80
CAC
cost per customer
$36
Contribution / order
AOV × gross margin
$161
LTV
contribution, lifetime
LTV : CAC
2.0 : 1
below your 3.0:1 target
CAC payback
15months
to earn the customer back
Max profitable CAC
$54
the most you can pay at 3.0:1
Break-even ROAS
1.82×
what an ad must return to clear COGS
Free · no account · no card
Get your 2027 budget built from your QuickBooks — P&L, balance sheet and cash flow, in Excel.
Why does CAC payback matter more than the ratio?
The ratio tells you if the unit economics work eventually. Payback tells you if you'll survive to get there. CAC payback is how long it takes a customer's contribution to earn back what you paid to acquire them — CAC ÷ contribution per order, converted from orders into months by how often they buy. For a cash-tight business, this is the number that actually bites: you pay the $80 today, but it comes back a trickle at a time.
Our brand earns $35.75 of contribution per order and sees ~1.8 orders a year, so it takes about 2.2 orders — roughly 15 months — to break even on a single customer. Fifteen months of fronting cash for every customer you acquire. Grow fast on a payback that long and you can be gloriously "profitable per customer" and still run the bank account dry — the same trap as working capital, wearing a marketing hat. A 3:1 ratio with a 3-month payback is a different business than a 3:1 ratio with an 18-month one.
What's the most you can pay for a customer?
Flip the ratio around and it hands you a spending ceiling. If you want to hold a 3:1 ratio, your maximum profitable CAC is LTV ÷ target ratio — for our brand, $161 ÷ 3 ≈ $54. They're paying $80. That single comparison — $80 paid against a $54 ceiling — is the whole problem stated in one line, and it's a bid cap you can take straight to your ad manager.
There's a sister number for the ad platform itself: break-even ROAS, or 1 ÷ gross margin. At a 55% margin that's 1.82× — a campaign has to return $1.82 in revenue per $1 of spend just to cover the product cost, before it contributes a cent to CAC or overhead. Anyone optimizing to a 1.0× ROAS "because it's breaking even" is quietly losing the whole gross margin.
How do you fix an upside-down ratio?
When the ratio is too low, there are only four levers — and notice that three of them raise LTV, which is usually where the leverage hides. Founders reach for "cut CAC" first because it feels controllable, but a customer who comes back one more time can move the ratio more than a month of ad-account tuning.
- Sell more per order (AOV). Bundles, a shipping threshold, a one-click upsell. Every extra dollar of order value flows to LTV at your margin rate.
- Widen the margin. LTV is built on contribution, so a few points of gross margin — better sourcing, lower shipping, fewer discounts — compounds across every lifetime order. (This is the number your income statement is really telling you.)
- Get them back (repeat rate). The biggest lever, and the most ignored. Take the apparel brand from 1.8 to 2.5 orders a year and LTV jumps from $161 to ~$223 — the ratio clears 2.7 without touching acquisition at all. Retention is unit economics.
- Lower CAC. Real, but the slowest and least durable — cut the worst-performing channels, fix the landing page, and stop paying to reacquire customers you already had.
Need your financials for a lender, a buyer or your accountant? Get the free financials pack →
See what an AI CFO says about your own numbers.
$99/mo, everything included. Free for 14 days, no card.
Prefer to run the numbers yourself? Try the free CAC & LTV Calculator — it’s free.