Budget vs. actual: reading a variance without drowning in it
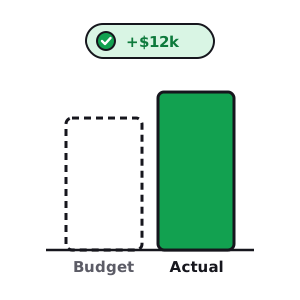
Setting a budget feels like the work. It isn't. A budget you never check against reality is just a wish you wrote down in January. The value is entirely in the comparison you do after the month closes — plan beside actual, and the gap between them, the variance, read honestly. Done right, every line of your P&L stops being weather that happens to you and turns into feedback you can act on. Done wrong, it's a wall of numbers you skim and forget. Here's how to read one like a CFO.
One month of a small business's P&L runs through the whole post:
| Line | Budget | Actual | Variance |
|---|---|---|---|
| Revenue | $200,000 | $212,000 | +$12,000 |
| Cost of goods sold | $80,000 | $91,000 | −$11,000 |
| Gross profit | $120,000 | $121,000 | +$1,000 |
| Payroll | $60,000 | $62,500 | −$2,500 |
| Marketing | $20,000 | $14,000 | +$6,000 |
| Rent | $8,000 | $8,000 | $0 |
| Other opex | $12,000 | $16,800 | −$4,800 |
| Operating income | $20,000 | $19,700 | −$300 |
Favorable or unfavorable? Mind the sign
The first thing that trips people up: a variance isn't good or bad because the number went up or down — it's good or bad by what it does to profit. Revenue coming in under plan is bad. A cost coming in over plan is bad. Those are the two "unfavorable" cases, and they point in opposite numeric directions, which is exactly why a raw "actual minus budget" column misleads.
- Revenue over budget → favorable. Our revenue beat by +$12,000.
- Cost over budget → unfavorable, even though the number is bigger. COGS came in $11,000 over — a coral line, not a green one.
- Cost under budget → favorable on paper. Marketing landed $6,000 light. Hold that one — under-spend isn't always a win, and we'll come back to it.
Colour the column by favorable/unfavorable, not by plus/minus, and the P&L starts reading like a scorecard instead of a spreadsheet.
The net number lies
Glance at the bottom line and you'd relax: operating income of $19,700 against a $20,000 plan is a $300 miss — you nailed it, close the laptop. That's the trap. That tidy −$300 is four loud stories cancelling each other out: revenue beat by $12,000, gross margin leaked, payroll and other opex crept over, and an under-spend on marketing quietly plugged the hole. A business that beats revenue by 6% and still lands flat on profit has a problem the summary line is actively hiding.
Flex the budget before you judge it
COGS looks like an $11,000 disaster. But hold on — revenue came in 6% over plan, so of course the cost of goods is higher; you made and sold more. Judging a variable cost against a budget built for lower volume isn't fair, and it sends you chasing a problem that's partly just success. The fix is to flex the budget: recompute what the cost should have been at the volume you actually did.
Budgeted COGS was 40% of revenue. At the actual $212,000 of revenue, a well-run month "should" cost $84,800 (40% × $212,000). Actual was $91,000. So:
Raw variance
−$11,000
vs the static budget
Volume portion
−$4,800
expected — you sold more
Real overage
−$6,200
margin actually leaked
Flexing splits "we're bigger" from "we're leaking." The honest problem isn't $11,000 — it's the $6,200 of margin that slipped: your cost ratio drifted from 40% to about 43%. That's a supplier price, a discount, or a waste problem worth a conversation. The other $4,800 was just you doing more business. Same logic flexes any variable cost; fixed costs like rent don't flex, which is why rent's $0 variance is genuinely a non-event.
Free · no account · no card
Get your 2027 budget built from your QuickBooks — P&L, balance sheet and cash flow, in Excel.
Chase the material, mute the noise
You do not have eight conversations after every close. A variance earns your attention when it's big in dollars or big in percent — pick a threshold and let the rest go. Say anything over $5,000 or 25%. That filter leaves four lines standing:
- Revenue, +$12,000. A real beat — worth understanding before you bank on it (more below).
- Margin, −$6,200 flexed. The quiet one that actually hurt.
- Marketing, +$6,000 (−30%). Favorable to profit, but did you choose to spend less, or fail to? If the revenue beat came without the planned marketing, great; if you starved demand generation to make the month look good, you borrowed from next quarter.
- Other opex, −$4,800 (−40%). A 40% overrun on a line item is always worth opening up.
Payroll's −$2,500 is a 4% wobble — noise, skip it. This is the whole discipline: four things to look at, not eight, and you found them by size, not by scanning every row with equal worry.
Is the miss price or volume?
One more layer on the big one. Revenue beat by $12,000 — but why? Did you sell more units, or did you charge more per unit? Those are completely different signals about the health of the business, and a variance column can't tell them apart. That's exactly the job of the price/volume/mix bridge — run it on the revenue line and your favorable variance splits into how much was price, how much was volume, and how much was mix. Budget-vs-actual tells you a line moved; the bridge tells you what moved it.
Make it a monthly habit
None of this is hard math — it's a subtraction and a percentage. The discipline is doing it every month, the same way, so the variances start talking to each other across time and a drifting cost ratio shows up in month two instead of month eight. That's the difference between a budget as a wish and a budget as a steering wheel.
Need your financials for a lender, a buyer or your accountant? Get the free financials pack →
See what an AI CFO says about your own numbers.
$99/mo, everything included. Free for 14 days, no card.
Prefer to run the numbers yourself? Try the free Budget vs. Actual template — it’s free.