Why did revenue change? Price, volume, and mix explained
Your revenue was $156,000 last quarter and $162,960 this one. Up 4.5% — good news, you file it away and move on. But that single number is three different stories wearing one trench coat, and at least one of them you need to hear. Did you raise prices? Sell more units? Or shift toward pricier products? Your accounting software shows you the before and the after; it will never tell you which of the three actually moved the line. That decomposition has a name — the price/volume/mix bridge — and pulling it apart is one of the most useful things a CFO does with a P&L.
We'll work the whole thing through one small example: a coffee roaster with two products — a House Blend and a premium Single-Origin — comparing last quarter (Q1) to this one (Q2).
| A | B | C | D | E | |
|---|---|---|---|---|---|
| 1 | Line | Q1 bags | Q1 price | Q2 bags | Q2 price |
| 2 | House Blend | 10,000 | $12.00 | 8,800 | $13.20 |
| 3 | Single-Origin | 2,000 | $18.00 | 2,600 | $18.00 |
| 4 | Total | 12,000 | 11,400 |
Notice the total bags: 12,000 in Q1, 11,400 in Q2. The roaster sold 600 fewer bags — and revenue still went up. That's the whole reason this exercise exists. Three forces are pushing on the number at once, and here they're pushing in different directions.
The three forces inside one number
- Price — you charged more (or less) for the same thing. Same bag, different sticker.
- Volume — you sold more (or fewer) units. Same sticker, different count.
- Mix — you sold a different blend. Even if no single price and no total unit count changed, selling relatively more of the expensive product pulls your average price — and your revenue — up on its own.
The bridge measures each one separately, so a move in one can't hide inside another. Let's take them in turn.
Price: charging more for the same thing
The price effect asks: holding this quarter's volumes fixed, how much did the change in price alone move revenue? Line by line, it's the price change times the new quantity — (new price − old price) × new units. House Blend went from $12.00 to $13.20, a 10% increase, on 8,800 bags; Single-Origin held flat.
=(13.20-12.00)*8800| A | B | C | |
|---|---|---|---|
| 1 | Line | Δ price | Price effect |
| 2 | House Blend | +$1.20 | +$10,560 |
| 3 | Single-Origin | $0.00 | $0 |
| 4 | Total | +$10,560 |
So +$10,560 of the revenue change is pure price — the roaster simply charging more. On its own, that's more than the entire $6,960 increase. Hold that thought.
Volume: more units, or fewer?
The volume effect asks: if you'd sold your change in units at last quarter's average price, what would that alone do to revenue? It's total unit change × prior average price. Prior average price is $156,000 ÷ 12,000 bags = $13.00 a bag, and units fell by 600.
Unit change
−600bags
12,000 → 11,400
× Prior avg price
$13.00
$156,000 ÷ 12,000
= Volume effect
−$7,800
fewer bags out the door
There it is in the open: volume cost the roaster −$7,800. Underlying demand shrank. The only reason revenue rose is that price and mix more than papered over it — which you'd never learn from the top line.
Mix: the silent one
Mix is the effect of selling a different blend than before. The premium Single-Origin went from 2,000 of 12,000 bags (17% of the mix) to 2,600 of 11,400 (23%). A richer mix lifts your blended price even if no individual price moved. Mix is the hardest of the three to compute directly, so the standard move — and what our free tool does — is to take it as the residual: whatever's left of the total change once price and volume are accounted for.
mix = total change − price effect − volume effectThat's $6,960 − $10,560 − (−$7,800) = +$4,200. Taking mix as the plug isn't a cheat — it's precisely the part of the change that isn't price or volume, which is exactly what "we sold a different blend" means. It also guarantees the bridge ties to the penny, every time.
Free · no account · no card
Get your 2027 budget built from your QuickBooks — P&L, balance sheet and cash flow, in Excel.
Read the bridge
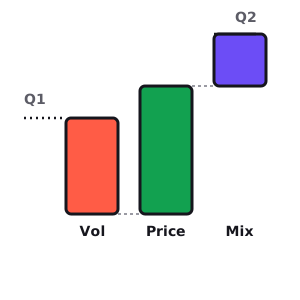
Now stack the three effects between where you started and where you landed. This is the bridge — the same shape as the artwork up top:
| Revenue bridge | Amount |
|---|---|
| Q1 revenue | $156,000 |
| Volume — 600 fewer bags | −$7,800 |
| Price — +10% on House Blend | +$10,560 |
| Mix — shifted toward premium | +$4,200 |
| Q2 revenue | $162,960 |
Volume
−$7,800
600 fewer bags
Price
+$10,560
+10% on House Blend
Mix
+$4,200
premium 17% → 23%
Read as one line, Q2 was a 4.5% growth quarter. Read as a bridge, it's a different business: a roaster whose unit demand is falling, holding revenue up with a price increase and a drift toward premium. Both statements are true. Only the second one tells you what to do — and it's the one the P&L buries.
It works on gross profit too
Everything above splits revenue. Feed the bridge your unit costs as well and it splits gross profit the same way, adding a fourth lever — a cost effect — that isolates margin you lost to rising input costs from margin you lost by discounting. That's the version that answers the genuinely scary question: "profit moved, and I can't tell if it was price, costs, or what we sold." Same machine, one more column.
What to do with the answer
- Price-led growth is fragile if volume is falling. You can raise prices once. If the bags keep walking, next quarter there's no lever left. Our roaster needs to know why volume dropped — not celebrate the 4.5%.
- A mix gain can be strategy or luck. Deliberately steering customers to the premium line is a plan you can repeat. Stumbling into it isn't. The bridge tells you it happened; you have to say which.
- Run it on a decline, too. When revenue drops, the bridge tells you whether you're losing customers (volume) or caving on price — two problems with opposite fixes.
Need your financials for a lender, a buyer or your accountant? Get the free financials pack →
See what an AI CFO says about your own numbers.
$99/mo, everything included. Free for 14 days, no card.
Prefer to run the numbers yourself? Try the free Price / Volume / Mix Bridge — it’s free.