Unit economics for a contractor: what one job really keeps
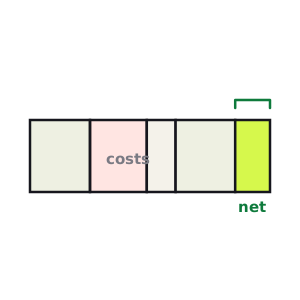
We've taken apart a D2C order, a SaaS subscription, a billable hour, and one restaurant cover. A contractor borrows a piece of each: it marks up materials like the D2C brand, it sells its crew's time like the services firm, and it lives on throughput against a fixed office nut like the restaurant. Which is why the most common feeling in the trades is the one that makes no sense on paper — we're busy, the jobs are profitable, and the account is still tight. Part five is about where the money on a job actually goes, and the two places it quietly leaks out.
The trap is that a contractor can see a fat margin and not have it. You marked the parts up 40%, you bill $150 an hour for labor that costs you $40 — the job looks like a winner the moment you write the estimate. Then the truck, the callbacks, the office, and the field hours that never reached an invoice each take a bite, and the winner turns out to keep a fraction of what the markup promised. Three rungs show you where it goes.
What is the "unit" in a contracting business?
For D2C it was one order; for SaaS, one customer; for a services firm, one billable hour; for a restaurant, one cover. For a contractor, the smallest repeating thing you sell is one job — one completed ticket, service call, or project. Not one hour (a trade bundles parts and labor, so the hour alone hides the markup) and not one month (that's the whole P&L). Every question about whether the business works is a story you can tell about a single job: what you charged, what it truly cost to put a crew and materials on it, and what survived the office behind it.
And the number you're chasing isn't the markup on the parts, or the spread between your bill rate and the wage — the two figures owners quote proudly. Those are the first rung. The honest measure is what a job contributes after every variable cost it drags along, and then what survives the fixed overhead standing behind the whole crew. That's the atom of the business.
The job that keeps less than the markup suggests
Let's run one job all the way down. Our example is an HVAC / plumbing service shop with an average ticket of $650 — a typical repair or install call. Parts run 25% of the ticket, and the job takes 2.5 field hours. That much every owner can rattle off. The line that surprises them is what those field hours actually cost — not the $40 loaded wage, but more, for a reason we'll get to in a second.
| Building one job | Amount | Running total |
|---|---|---|
| Average job price | $650.00 | $650.00 |
| − Materials & parts (25%) | -$162.50 | $487.50 |
| − Field labor (2.5 hrs, loaded) | -$153.85 | $333.65 |
| = Gross profit (J1) | $333.65 | 51% |
| − Truck, permits, callbacks (12%) | -$78.00 | $255.65 |
| = Contribution (J2) | $255.65 | 39% |
| − Office overhead per job | -$161.54 | $94.12 |
| = Net per job (J3) | $94.12 | 14% |
A ticket that looked like it was mostly profit keeps about $94 once every cost has had its say — real money, and a genuinely healthy job, but a long way from what the parts markup and the bill rate implied. The two lines that did the damage are the field labor, larger than the materials, and the $161 of office overhead each job had to carry. That labor line is the one worth stopping on, because it's where most trades quietly lose money.
The field hour that never reaches the invoice
Here's the line that sinks more trades P&Ls than any other. You pay a tech a loaded $40 an hour — wage plus payroll taxes, insurance, and benefits. But a tech paid for eight hours doesn't bill eight hours. Drive time between calls, loading and restocking the truck, warranty callbacks, and estimates that never close all eat the day. If only about 65% of paid hours actually land on a customer's invoice — a normal number in the field — then the honest cost of a billed hour isn't $40. It's the whole day's wage spread over the hours that paid for themselves:
| The utilization math | Amount |
|---|---|
| Loaded cost per paid hour | $40.00 |
| Utilization (billed ÷ paid) | 65% |
| = True cost per billed hour | $61.54 |
That's why the waterfall charged 2.5 × $61.54 = $153.85 for labor, not 2.5 × $40 = $100. The $54 gap is the unbilled part of the day, and it doesn't disappear just because you didn't invoice it — it comes straight out of the job. It's the exact lever that decides a services firm, wearing a tool belt: a person costs the same whether they bill half the week or all of it, so every point of utilization you claw back drops almost straight to the bottom line.
J1, J2, J3: the contractor ladder
D2C operators count in CM1/CM2/CM3, SaaS in L1/L2/L3, services in R1/R2/R3, restaurants in C1/C2/C3. A contractor climbs the same three steps — gross, then contribution, then net. Call the rungs J1, J2, J3, J for job.
- J1 — gross profit. Price minus the direct cost of doing the job: materials, any subcontractors, and the loaded field labor. $650 − $162.50 − $153.85 = $333.65. The "we marked up the parts and billed the hours" number — necessary, flattering, and nowhere near the whole story.
- J2 — contribution. J1 minus the other costs a job drags along whether you invoice them or not: truck and fuel, permits and disposal, a reserve for warranty callbacks, financing or sales commission. $333.65 − $78 = $255.65. The cash the job actually throws off toward the office.
- J3 — net per job. J2 minus the fixed office overhead spread across the jobs you run. $255.65 − $161.54 ≈ $94.12. The real profit on a job — about 14% of the ticket, which is a good service trade.
J1 · gross / job
$333.65
51% — after materials & labor
J2 · contribution / job
$255.65
39% — after truck & callbacks
J3 · net / job
$94.12
14% — what's really yours
Read left to right and the shop works. At 260 jobs a month — a four-tech crew running a couple of calls a day — that's about $169,000 of revenue dropping roughly $24,000 to the bottom line. But notice how you'd never see that $94 by looking at the estimate: you bill $650 ÷ 2.5 = $260 a field hour and keep about $38 of it. The gap between those two numbers is the entire reason busy contractors get blindsided.
Free · no account · no card
Get your 2027 budget built from your QuickBooks — P&L, balance sheet and cash flow, in Excel.
Build your own job
Your shop isn't this one. A remodeler bills a $28,000 project but subs half of it out and floats the rest until the draw lands; an electrician runs cleaner tickets at higher utilization; a lawn-care route lives on a $70 stop where drive time between properties wrecks the day. Put in your real ticket, your materials and field-labor, the utilization your crew actually runs, and your monthly overhead, and watch the ladder — and the two reads that decide everything — resolve:
The job
The field labor
Throughput & the office nut
$333.65
J1 · gross / job
after materials, subs & field labor
51% of price
$255.65
J2 · contribution / job
after the truck, permits & callbacks
39% of price
$94.12
J3 · net / job
after office overhead — yours
14% of price
Break-even jobs / month
164
you run 260 — the profit is the last 96
Direct job cost
49%
materials + subs + labor · you bill $260/field-hr, it costs $62
Prefer a spreadsheet? Open the free Unit Economics calculator to run all five business models side by side and download a branded, formula-driven Excel of your own job.
Two knobs move everything. Drag utilization from 65% down toward 55% and watch net per job fall while nothing about the job itself changed — that's the unbilled part of the day getting heavier. Then drop jobs a month and watch the office overhead per job climb, because the same nut is now split across fewer tickets. Labor efficiency and throughput are the two levers, and both hide from the estimate.
The two reads a contractor lives by
The first is your version of a restaurant's prime cost: direct job cost % — materials plus subs plus field labor as a share of the price. Ours is ($162.50 + $153.85) ÷ $650 ≈ 49%, which leaves daylight for the overhead and a profit. Let it drift toward 60%+ — through slipping utilization, material inflation you didn't reprice, or underbid labor — and there simply isn't room, no matter how many jobs you run. The second is break-even jobs: divide the fixed monthly overhead by the contribution per job — $42,000 ÷ $255.65 ≈ 164 jobs a month. You run 260. So 164 of every 260 jobs exist only to keep the office lights on; the profit is the last 96.
Direct job cost
49%
materials + labor — under the ~55% line
Break-even
164jobs / mo
of 260 you run — the rest just pays overhead
Margin of safety
37%
how far your month sits above break-even
A 37% margin of safety is more room than a restaurant ever gets — the trades aren't a knife-edge on profit the way hospitality is. Their knife-edge is somewhere else entirely, and it's the reason a shop with all of these numbers pointing the right way can still run out of cash.
The cash gap: why a profitable job can still sink you
Here's the cost a box or a subscription never carries. On the $650 service call, the timing is forgiving — you buy the part, do the work, and collect the same day. But scale up to the remodeler's $28,000 project and the timing turns lethal: you buy the materials and pay the subs in weeks one and two, and the customer pays you on a draw schedule, on completion, or net-30 — weeks later. Every growing job pulls cash out before it puts any back, so the busier you get, the more cash the growth consumes. That's the trades' version of being profitable but broke: the P&L says you made money and the bank account says you're drowning, because your cash is buried in work-in-progress you haven't billed and receivables you haven't collected. It's the front half of your cash conversion cycle, and managing it — deposits, progress billing, disciplined working capital — is as much of the job as the estimate is.
Four levers that move the job
When J3 is thin or break-even sits too close to a slow month, there are only a handful of places to push — and the one owners reach for first (mark the parts up harder) is rarely the biggest.
- Buy back billable hours first. Utilization is the highest-leverage number you have because every point you recover drops almost straight to net. Tighter routing to cut windshield time, a stocked truck so techs aren't running to the supply house, and killing the callbacks that make you do a job twice — each turns paid hours you're already buying into billed ones.
- Price the labor, not just the parts. Most trades over-mark materials and under-price labor, which is backwards — the labor line is bigger and it's the one that carries your true cost per billed hour. Make sure the bill rate covers the utilized cost of an hour with a real margin on top, not the wage.
- Then defend contribution — the quiet costs. Warranty callbacks, disposal, and fuel don't show up on the estimate but they're real; a small reserve for them per job keeps J2 honest, and cutting the callback rate lifts it directly.
- Right-size the office, and bill faster. Overhead per job only shrinks two ways — more jobs over the same nut, or a leaner nut. And on bigger work, the cash gap is a lever too: deposits and progress billing turn a job you were financing for the customer into one that funds itself.
Need your financials for a lender, a buyer or your accountant? Get the free financials pack →
See what an AI CFO says about your own numbers.
$99/mo, everything included. Free for 14 days, no card.