Where the money actually goes: reading operating expenses like a CFO
Most founders can recite their revenue to the dollar and could not tell you their third-largest expense. That is backwards. Revenue is the number you have the least direct control over in any given month. Operating expenses are almost entirely a set of decisions you made — and can unmake.
The trouble is that the opex block of a P&L is the least readable part of the statement. Thirty rows, alphabetical, no hierarchy, and no signal about which ones matter. Here is how to actually read it.
Start with concentration, not the list
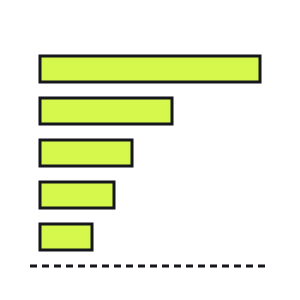
Sort your operating expenses largest to smallest and look at where the cumulative total crosses 80%. In almost every small business, four to six accounts get you there, and everything below is noise you should stop spending attention on.
This is the single highest-leverage move in expense management: it converts a thirty-row list into a five-row list. A 10% cut to your top line item is usually worth more than eliminating the bottom fifteen entirely, and it costs you far less goodwill to negotiate one contract than to nickel-and-dime a dozen.
| Account | Month | % of opex | Cumulative |
|---|---|---|---|
| Salaries and wages | $41,200 | 44.3% | 44.3% |
| Rent and occupancy | $12,000 | 12.9% | 57.2% |
| Contractors | $8,400 | 9.0% | 66.2% |
| Advertising | $8,100 | 8.7% | 74.9% |
| Software and subscriptions | $6,300 | 6.8% | 81.7% |
| Everything else (22 accounts) | $17,000 | 18.3% | 100% |
| Total operating expenses | $93,000 | 100% |
Read every line as a share of revenue
A dollar figure on its own cannot tell you whether a cost is a problem. Advertising went from $6,400 to $8,100 — is that bad? You have no idea until you know what revenue did. As a share of revenue it went from 5.1% to 5.4%, which is nothing. If revenue had been flat, it would be a 27% increase in your customer acquisition cost and worth a conversation.
The percent-of-revenue view is what makes expenses comparable across months, across seasons, and against anyone else's business. It also automatically separates your costs into the two categories that matter: the ones that scale with the business, and the ones that do not.
Opex as % of revenue
62%
vs 58% three months ago
Fixed share
$63k
unchanged whatever you sell
Variable share
$30k
moves with volume
Ask what moved, not what is big
Big is not the same as interesting. Rent is your second-largest expense and it will be identical next month; there is nothing to learn from it. The useful question is what changed, and by how much against the prior period.
Build the bridge: prior month total, then each account that moved by a material amount, then this month's total. Three or four lines usually explain almost the entire swing, and each one has a story attached — a new hire, a campaign, an annual renewal that landed in one month, a one-off repair. Once you can name the story, you know whether to expect it again.
| Driver | Change | Repeats? |
|---|---|---|
| Opex last month | $86,500 | |
| Insurance annual renewal | +$3,100 | Once a year |
| New contractor engagement | +$2,800 | Yes, ongoing |
| Trade show booth | +$1,900 | Seasonal |
| Advertising pullback | -$1,300 | Deliberate |
| Opex this month | $93,000 |
Free · no account · no card
Get your 2027 budget built from your QuickBooks — P&L, balance sheet and cash flow, in Excel.
The three questions worth asking each line
Once you are down to the five accounts that matter, the review is short:
- Is it fixed or variable? A fixed cost is a commitment you renew by doing nothing. It deserves an annual decision, not a passive one.
- What would happen if it went to zero? Not as a plan — as a way of finding out what the cost is buying. If you cannot answer quickly, that is the finding.
- Is it growing faster than revenue? Any cost outrunning your top line is quietly compressing your margin, and it will keep doing so until someone stops it.
Do this monthly, in ten minutes
None of this requires a finance background or a spreadsheet rebuild. Sort by size, look at the top five, express each as a share of revenue, and name the three things that moved. Ten minutes a month, and you will catch cost drift a quarter or two before it shows up as a bad year.
The businesses that get squeezed are rarely the ones that made one expensive mistake. They are the ones where six or seven costs each crept up by a few points, nobody looked at the block as a whole, and the margin was gone before anyone named a cause.
Need your financials for a lender, a buyer or your accountant? Get the free financials pack →
See what an AI CFO says about your own numbers.
$99/mo, everything included. Free for 14 days, no card.
Prefer to run the numbers yourself? Try the free Budget vs. Actual template — it’s free.